
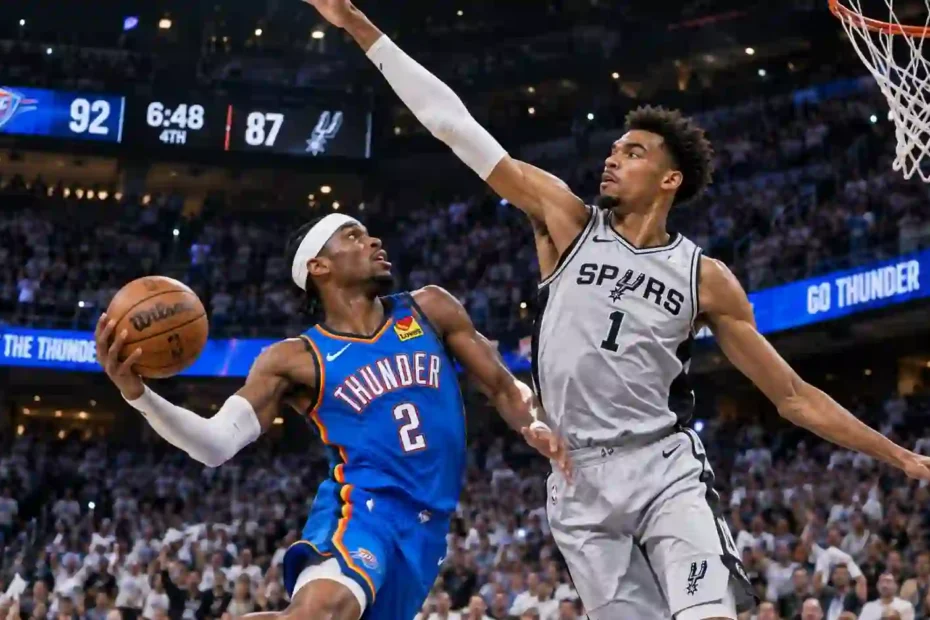
The Western Conference Finals between the Oklahoma City Thunder and San Antonio Spurs delivered a seven-game war that flipped the script on everything NBA fans thought they knew about both rosters. One night, Shai Gilgeous-Alexander looked unstoppable. The next, Victor Wembanyama erased him entirely.
This article hands you the full Oklahoma City Thunder vs San Antonio Spurs match player stats breakdown, including quarter-by-quarter data, team comparison tables, and the hidden turning points most recaps missed. By the end, you will understand exactly why this series went the distance and which numbers actually decided it.
Series Scorecard: Every Game at a Glance
The Spurs won the series 4-3, but the final margin hides how chaotic things got. Oklahoma City opened as the defending champion and jumped out to a 24-1 start to the season before hitting turbulence mid-year.
Here is the complete game-by-game scorecard with quarter splits.
| Game | Date | OKC | SAS | OKC Q1-Q4 | SAS Q1-Q4 | Winner |
| Game 1 | May 18 | 115 | 122 (2OT) | 27-17-29-28 | 27-24-29-21 | SAS |
| Game 2 | May 20 | 122 | 113 | 31-31-34-26 | 31-20-37-25 | OKC |
| Game 3 | May 22 | 123 | 108 | 26-32-37-28 | 31-20-33-24 | OKC |
| Game 4 | May 24 | 82 | 103 | 19-19-22-22 | 28-22-28-25 | SAS |
| Game 5 | May 26 | 127 | 114 | 29-40-32-26 | 27-31-33-23 | OKC |
| Game 6 | May 28 | 91 | 118 | 22-31-13-25 | 35-25-32-26 | SAS |
| Game 7 | May 30 | 103 | 111 | 25-28-24-26 | 32-24-24-31 | SAS |
The Game 4 blowout stands out immediately. Oklahoma City scored just 82 points, their second-lowest postseason total of the entire run. San Antonio held them to 33% shooting from the field and a brutal 6-for-33 from three-point range. The Spurs also forced 20 turnovers in that win.
That defensive performance is the hidden engine behind the Spurs’ series win, and the player stats confirm it.
Team Comparison Stats: Where the Series Was Really Won
Raw scoring averages tell a shallow story. The deeper team stats reveal a San Antonio squad that controlled pace, punished turnovers, and dominated the paint when it mattered.
| Stat Category | Oklahoma City Thunder | San Antonio Spurs |
| Points Per Game (Series) | 110.7 | 112.7 |
| Field Goal % (Game 2) | 48% (45-94) | 49% (41-84) |
| 3-Point % (Game 2) | 36% (13-36) | 40% (16-40) |
| Free Throw % (Game 2) | 79% (19-24) | 88% (15-17) |
| Turnovers (Game 2) | 10 | 21 |
| Rebounds (Game 2) | 41 | 45 |
| Bench Points (Game 3) | 76 | 23 |
The bench battle flipped dramatically across the series. In Game 3, Oklahoma City outscored San Antonio’s reserves 76-23. By Game 4, the Spurs’ bench responded with 30 points while limiting OKC’s second unit to just 34 total bench points across the entire game.
That swing from a 53-point bench advantage to near-parity changed the entire series calculus.
Top Player Performance Breakdown
Shai Gilgeous-Alexander: The Struggles Behind the Star
SGA entered the series as the reigning MVP and the engine of everything Oklahoma City runs. But San Antonio built a defensive wall specifically designed to make him uncomfortable.
- Game 4: 19 points on 6-for-15 shooting, including 0-for-1 from three.
- Game 6: 15 points on 6-for-18 shooting, 0-for-5 from deep, with only 4 assists and a -28 plus-minus.
Those two games represent the clearest statistical fingerprint of San Antonio’s defensive scheme. They forced him into contested mid-range looks and cut off his driving lanes with Wembanyama waiting at the rim.
| Player | Team | Points | Rebounds | Assists | FG% | 3P% |
| Shai Gilgeous-Alexander | OKC | 15 | 1 | 4 | 33.3% | 0.0% |
| Chet Holmgren | OKC | 10 | 11 | 1 | 50.0% | 0.0% |
| Jared McCain | OKC | 13 | 2 | 6 | 36.4% | 66.7% |
| Isaiah Hartenstein | OKC | 10 | 5 | 3 | 50.0% | 0.0% |
| Victor Wembanyama | SAS | 33 | 8 | 5 | 50.0% | 42.9% |
| De’Aaron Fox | SAS | 12 | 10 | 5 | 38.5% | 50.0% |
| Stephon Castle | SAS | 13 | 3 | 6 | 45.5% | 33.3% |
Wembanyama’s Game 4 performance (33 points, eight rebounds, five assists, three blocks) was the single most dominant individual stat line of the entire series. He shot 11-for-22 from the field and 3-for-7 from three in just 31 minutes of action. His +29 plus-minus was a team high.
He took the Game 3 loss personally and responded with a performance that shifted the momentum permanently. The Spurs center even hit a half-court buzzer-beater to end the first half, a moment that broke Oklahoma City’s spirit.
Quarter-by-Quarter Turning Points
Basketball games are rarely decided in the final two minutes alone. The quarter data from this series exposes exactly where Oklahoma City lost control.
| Quarter | OKC Points (Game 6) | SAS Points (Game 6) | Key Stat |
| Q1 | 22 | 35 | SAS opened on a massive run |
| Q2 | 31 | 25 | OKC briefly stabilized |
| Q3 | 13 | 32 | The knockout punch |
| Q4 | 25 | 26 | Garbage time |
Game 6 tells the whole story in one table. San Antonio exploded for 35 first-quarter points and then delivered a 32-13 third-quarter demolition.
That third-quarter gap is where the series died for Oklahoma City. A 19-point differential in twelve minutes erased any halftime adjustments the Thunder had made.
Why the Third Quarter Collapsed
- Oklahoma City shot just 6-for-28 from the field in the third quarter of Game 6, including 0-for-8 from three-point range.
- Their effective field goal percentage in that quarter was a dismal .214.
- San Antonio’s defensive rotations cut off kick-out threes, forcing OKC into contested mid-range attempts.
Devin Vassell summed it up perfectly after Game 4: “You get stops, you don’t try and focus on the offensive end, you get stops, you get out of transition. You guard your yard and that’s what we did.”
Head-to-Head Season Context
This playoff series did not happen in a vacuum. The regular season already hinted that San Antonio matched up well against Oklahoma City.
| Date | OKC | SAS | Venue | Winner |
| Dec 23, 2025 | 110 | 130 | Frost Bank Center | SAS |
| Dec 25, 2025 | 102 | 117 | Paycom Center | SAS |
| Jan 13, 2026 | 119 | 98 | Paycom Center | OKC |
| Feb 4, 2026 | 106 | 116 | Frost Bank Center | SAS |
Oklahoma City started the season 24-1 but then lost three of four regular-season meetings against the Spurs. That pattern carried directly into the playoffs.
The historical head-to-head record also leans San Antonio’s way in the regular season (106-90), though Oklahoma City holds a playoff edge (19-15).
What the Stats Reveal About Each Team’s Identity
Oklahoma City Thunder: Elite Until the Wall Appears
- SGA remains a top-five scorer in the league, but the Spurs forced him into his least efficient games of the postseason.
- Chet Holmgren’s rebounding (11 boards in Game 6) was a bright spot, but his offensive output was inconsistent.
- Jared McCain provided a spark off the bench with 13 points and 6 assists in Game 6, but the supporting cast could not compensate for SGA’s struggles.
- The Thunder’s three-point shooting disappeared in critical moments, going 6-for-33 in Game 4 and 0-for-8 in the third quarter of Game 6.
San Antonio Spurs: Built for Playoff Grinding
- Wembanyama’s two-way dominance makes him the ultimate playoff weapon, capable of scoring 33 and blocking shots on the other end.
- De’Aaron Fox’s rebounding from the guard position (10 boards in Game 4) gave San Antonio extra possessions that OKC could not match.
- The Spurs never lost three consecutive games all season, a resilience marker that showed up repeatedly in this series.
- Vassell and Castle provided reliable secondary scoring, combining for 26 points in Game 4 alone.
FAQs
How many points did Victor Wembanyama score in Game 4 against the Thunder?
Wembanyama dropped 33 points in Game 4, along with eight rebounds, five assists, and three blocks. He shot 11-for-22 from the field and 3-for-7 from three-point range. It was the most complete individual performance of the series and directly tied the Western Conference Finals at 2-2.
What was Shai Gilgeous-Alexander’s shooting percentage in the 2026 playoffs against the Spurs?
SGA struggled in the key games. He shot 6-for-15 in Game 4 and 6-for-18 in Game 6. The Spurs’ defensive scheme forced him into low-percentage looks and eliminated his three-point shot entirely in those contests.
Which team won the 2026 Western Conference Finals between the Thunder and Spurs?
The San Antonio Spurs won the series 4-3, closing it out with a 111-103 victory in Game 7 on May 30, 2026. It was their first NBA Finals appearance since 2014.
How did the Spurs shut down Oklahoma City’s offense in Game 4?
San Antonio held the Thunder to 33% field goal shooting and 18% from three-point range. They rotated aggressively on shooters and used Wembanyama as a rim-protecting anchor to erase drives. The Spurs also forced 20 turnovers in the win.
Who had the best plus-minus rating in Game 6 of the series?
Shai Gilgeous-Alexander finished with a -28 plus-minus in Game 6, the worst on the Thunder roster. San Antonio’s starters all posted positive ratings, with multiple players in the +20 range.
What was the bench scoring difference in Game 3 versus Game 4?
In Game 3, Oklahoma City’s bench outscored San Antonio’s 76-23. The Spurs flipped that script in Game 4, scoring 30 bench points while limiting OKC’s reserves to 34 total team bench points.
How did De’Aaron Fox contribute in Game 4 despite struggling to score?
Fox shot just 5-for-13 from the field for 12 points, but he grabbed 10 rebounds and dished out 5 assists without committing a single turnover. His defensive effort and rebounding from the guard position gave San Antonio extra possessions that proved critical in the blowout win.
Final Verdict: What This Series Taught Us
The Oklahoma City Thunder vs San Antonio Spurs match player stats paint a picture of two elite teams separated by one critical variable: defensive adaptability. Oklahoma City had the star power and the regular-season record. San Antonio had the scheme, the length, and the resilience.
Wembanyama’s ability to dominate both ends of the floor turned this from a shootout into a chess match. When SGA could not find clean looks, the Thunder had no reliable Plan B. The Spurs, meanwhile, got contributions from Fox, Vassell, Castle, and their bench when it mattered most.
If you are building a fantasy roster or breaking down playoff matchups, bookmark this stats breakdown. The numbers here tell you more about how these two teams actually function than any highlight reel ever could.